What your cohort report will look like.
The structure, fields, and visual format of every Crucible Care outcomes report — the five measures, the published risk thresholds they’re scored against, and where your cohort’s numbers land. The numbers in your report come from your own residents, your own cohort, your own twelve weeks.
Cited thresholds. Labeled samples. Your residents’ data.
The five measures
Scored against the published thresholds your clinical team already uses. The only numbers in this section are those thresholds — your cohort’s numbers fill this structure at weeks 1, 6, and 12.
<8 reps
high-risk threshold
Sit-to-Stand
Chair stands completed in 30 seconds — the lower-body strength measure. Your report shows the cohort average at weeks 1, 6, and 12, and the change.
≥12 s
at-risk screening cutoff
Timed Up & Go
Rise, walk three meters, turn, return, sit. Lower is safer. Twelve seconds or more flags fall risk under CDC STEADI.
<5 s
high-risk threshold
Single-Leg Balance
Timed balance hold near support. Your cohort's baseline-to-final change lands in this slot.
3 bands
low · moderate · high
Fall-risk category
Each resident is classified every assessment round. The report counts who moved to a lower band by week 12 — the headline number.
Wk 1·6·12
three assessment rounds
Attendance & completion
Per-resident attendance and who completed all 12 weeks — the context behind every outcome number in the report.
Per-cohort outcomes are reported on each facility’s own residents’ data using these five assessments and thresholds. Crucible Care claims no outcome percentages of its own: every figure in the report previews below comes from a clearly labeled fictional sample cohort, and the outcomes in your report come from your residents’ actual data.
The data
Five tests. Three time points. One clear picture.
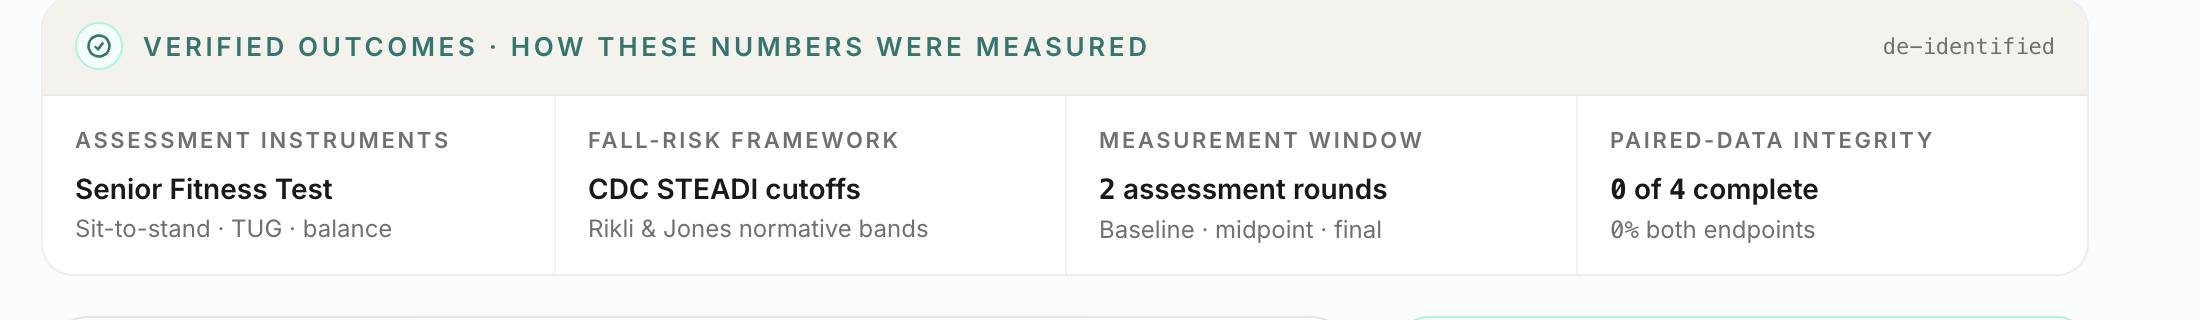
The same five assessments administered at baseline, week 6, and week 12. Your report fills in the cohort averages and per-resident changes — using published geriatric protocols, not proprietary scoring.
| Assessment | What it measures | Protocol | Risk threshold |
|---|---|---|---|
| 30-Sec Sit-to-Stand | Lower-body strength — chair stands completed in 30 seconds | Rikli & Jones Senior Fitness Test | <8 reps = high risk |
| Timed Up & Go | Functional mobility — rise, walk 3 m, turn, return, sit | CDC STEADI | ≥12 s = at-risk screen |
| Single-Leg Balance | Static balance — timed hold near support | Published geriatric norms | <5 s = high risk |
| Grip Strength | Overall strength proxy — dynamometer, best attempt | Rikli & Jones age/sex norms | Age/sex-normed |
| Confidence Score | Self-reported steadiness and confidence, 0–10 | Self-report scale | Tracked as a trend |
Your report shows the cohort average for each measure at baseline, midpoint, and final, the change over twelve weeks, and each resident’s movement against these thresholds.
The summary view
Two cards leadership actually opens.
The PDF leads with these. Cohort-level fall-risk movement on the left. Attendance, assessments, shift count, and completion on the right. Same components render in the portal scorecard from your residents’ live data.
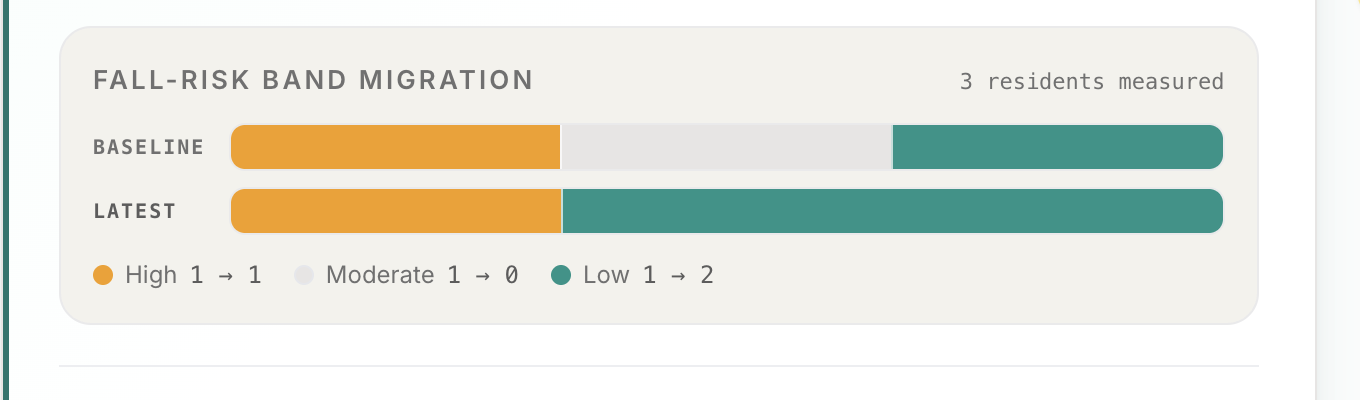
Fall-risk category shift
What a Week-12 outcomes report looks like
- Out of elevated
- 3 residents
- Into low risk
- +4 residents
14-resident cohort. Categories derived from CDC STEADI and the Rikli & Jones Senior Fitness Test battery, scored at baseline and re-scored at the follow-up window. Movement between categories is what the report documents — not a guarantee.
Director summary
Week 12 cohort summary
Attendance
87%
Across 24 sessions
Assessments complete
14/14
Baseline · midpoint · final
Shifted to a lower band
7
Of 14 residents at baseline
Completed the program
13/14
One scheduled drop
- Branded PDF
- Family viewer
- Surveyor packet
What leadership receives at Week 12. The portal generates this from your cohort's real attendance, assessment, and fall-risk data.
The outcomes report
One document. Every audience.
Every cohort closes with a branded PDF. Your facility name on the cover, your residents' data inside. Generated in the platform. Ready to print, email, or present the week the cohort ends.
12-week outcomes report
Your Facility
Cohort 1 · Spring 2026
Tagline
Strong Today.
Independent Tomorrow.
Fall-risk category shift
Baseline → Week 12
- Out of elevated
- 3
- Into low risk
- +4
Per-resident detail
Baseline → Final (de-identified)
- M.S.ElevatedModerate
- R.K.ModerateLow
- D.O.ElevatedElevated
- J.P.ModerateLow
- B.T.LowLow
Five clinical measures per resident on each row in the full report.
Opens in your browser. Same structure your facility's report uses; per-resident initials are illustrative.
Report audiences
The same PDF goes four places.
Regional VP
Clinical outcome data and ROI documentation for the annual wellness budget review.
Families
Per-resident progress showing exactly what changed for their loved one over 12 weeks.
State Surveyor
Documented evidence of structured wellness programming with standardized measurement.
Your Board
A defensible answer to 'what is our fall prevention program producing?'
Methodology
Published geriatric research, not in-house scoring.
Assessment tools, risk thresholds, and the program design follow established research your clinical team will recognize:
CDC STEADI
Stopping Elderly Accidents, Deaths & Injuries initiative. TUG at-risk screening cutoff (≥12 s) and clinical screening criteria.
Rikli & Jones Senior Fitness Test
Published normative data for 60–94 year-olds across 6 fitness dimensions. The 30-second sit-to-stand is a primary measure.
Sherrington 2019 · Cochrane Review
High-certainty evidence that structured strength-and-balance training reduces fall rates by about 24%. The evidence base this program is built on.
Administered by
Your activity director or wellness coordinator
Standardized protocol. Written instructions. No fitness certification required. The same staff member runs all three assessment rounds so results are comparable.
Assessed at
Not anecdotes. Not photo days. Five clinical measures, re-scored at Weeks 1, 6, and 12, with a per-resident and cohort-level report a director can read off the page.
See what this produces for your community.
Fifteen minutes with a Crucible Care coach. Real numbers, no deck. Walk away with a clear picture of what your first cohort would look like.
Or view the sample outcomes report — same structure your facility's report uses.